Boost your website’s speed and user experience! Discover top tools, key metrics, and optimisation tips to keep your site fast, efficient, and SEO-friendly.
Want to see how your website is doing? Performance check website tools can help you measure load times and user experience. For example, these tools can find issues like big HTML and CSS file sizes that might be slowing down your site. This article covers the best tools and techniques to keep your site fast and efficient.
- Website speed is important for user experience and SEO; even small delays can kill conversions.
- Tracking key performance metrics like LCP and FID will ensure your site meets Core Web Vitals.
- Tools like Google PageSpeed Insights, GTmetrix and Pingdom are must have for analysing and improving website performance.
What is Website Performance
The speed at which your website’s pages load and react to user actions is a key indicator of its performance. This is a big factor in user experience and can greatly impact your site’s success.
To keep your website fast and efficient you need to monitor and improve it consistently so users have a seamless browsing experience.
What is a Slow Website
A slow website is one that takes too long to load and frustrates users and potential abandonment. Generally a website is considered slow if it takes more than 3 seconds to load, although ideal load time is under 1 second. There are many factors that can cause a slow website including big file sizes, too many HTTP requests and inefficient coding practices. The consequences of a slow website are huge, it affects user experience, search engine rankings and conversion rates. Users will leave a slow website, resulting to higher bounce rates and lower engagement which can harm your site’s visibility and overall success.
Why Speed Matters
Website speed is crucial to a website’s effectiveness. A slow website can significantly decrease organic SEO traffic from search engines like Google, reducing your site’s visibility and reach to your target audience. Studies have shown that even a small delay – 100 milliseconds – in page load time can affect conversion rates so speed of page load is important for websites.For example, Yelp increased their conversion rates by 15% when they improved their key performance metrics like First Contentful Paint (FCP) and Time to Interactive (TTI). Agrofy reduced their abandonment rates by 76% after optimising their website performance metrics related to user engagement and page load times.
In short, website performance encompasses load times, user experience and visitor retention – all of which are heavily influenced by Core Web Vitals. By minimising resources and focusing on web page speeds. Websites will see a huge increase in user engagement since faster sites are better at keeping visitor interest.
Key Metrics to Monitor
Monitoring key metrics is important to measure website performance. The time it takes for the main content on a page to be fully visible is called Largest Contentful Paint (LCP) is an important aspect that affects how users perceive the site. As one of the Core Web Vitals metrics, LCP has a big impact on user satisfaction.
For example, tracking metrics like LCP and FID can find performance issues like big HTML and CSS file sizes that slow down page load times.
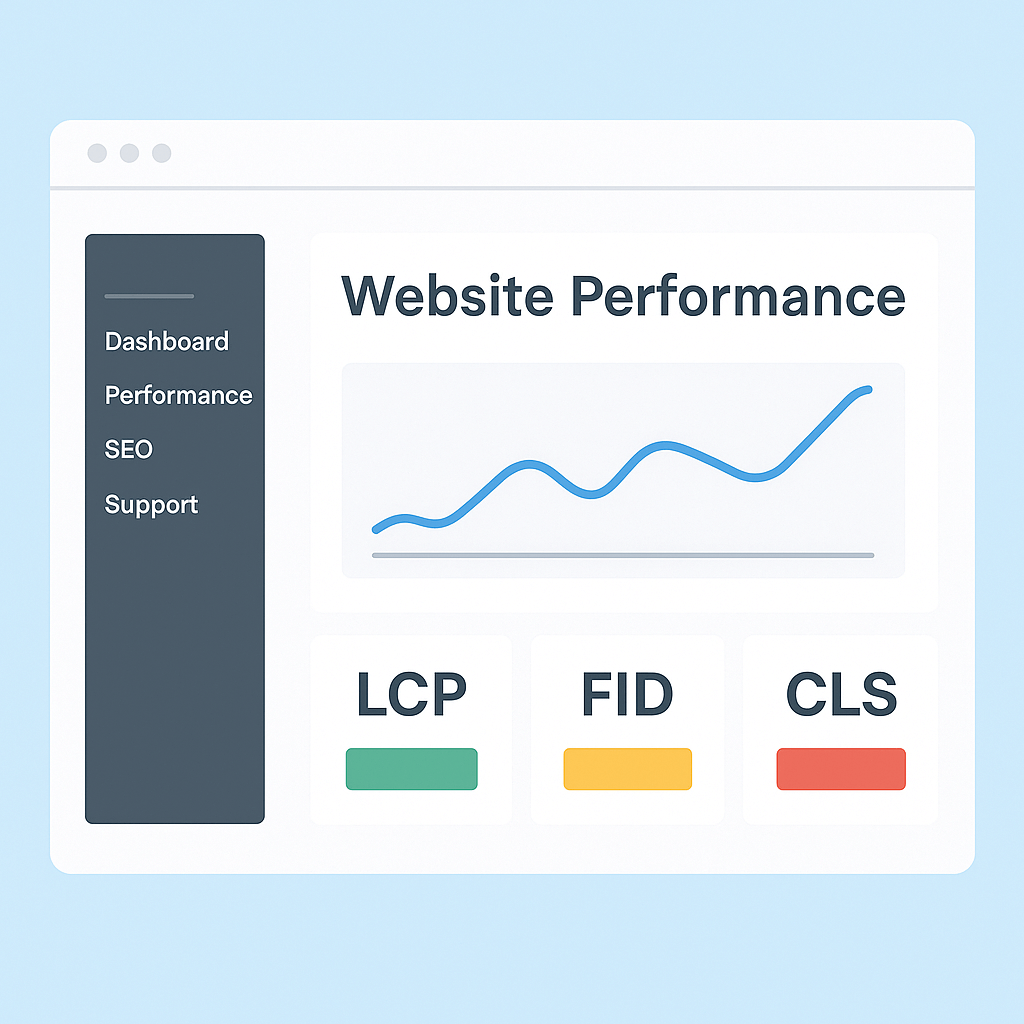
Other important metrics are First Input Delay (FID) which measures how fast a web page becomes interactive with users and Cumulative Layout Shift (CLS) which measures how stable a page’s visual elements are during loading. Focusing on these basic metrics will ensure you meet Core Web Vitals and have better user experience on your website.
Core Web Vitals and Lab Data
Core Web Vitals are a set of specific metrics introduced by Google to measure website user experience. These metrics are important to measure website performance and includes Largest Contentful Paint (LCP), First Input Delay (FID), and Cumulative Layout Shift (CLS). Each of these metrics focuses on different aspects of user experience like loading performance, interactivity and visual stability.
Lab data is collected in a controlled environment using tools like Lighthouse. This type of data is valuable for debugging and provides a detailed and accurate picture of a website’s performance. However, it may not always capture real-world bottlenecks that users experience. By combining Core Web Vitals with lab data, you can get a full understanding of your website’s performance and identify areas for improvement.
Real User Metrics and Field DataReal user metrics, also known as field data, are collected from actual users as they interact with your website. This type of data provides a more accurate and realistic picture of your website’s performance, capturing the true user experience. Key metrics in real user metrics include page load time, time to interactive, and total blocking time. Field data is important to identify patterns and issues that may not be apparent in lab testing. By analysing real user metrics, website owners can continuously optimise their site for better performance and have a smooth and enjoyable experience for all visitors.
Website Performance Testing Tools
There are many tools to help you evaluate and improve your website’s performance. They can check for page speed, resources used and potential improvements.
Google PageSpeed Insights, GTmetrix and Pingdom Tools are among the most popular tools for their unique features that can help you optimise your site.
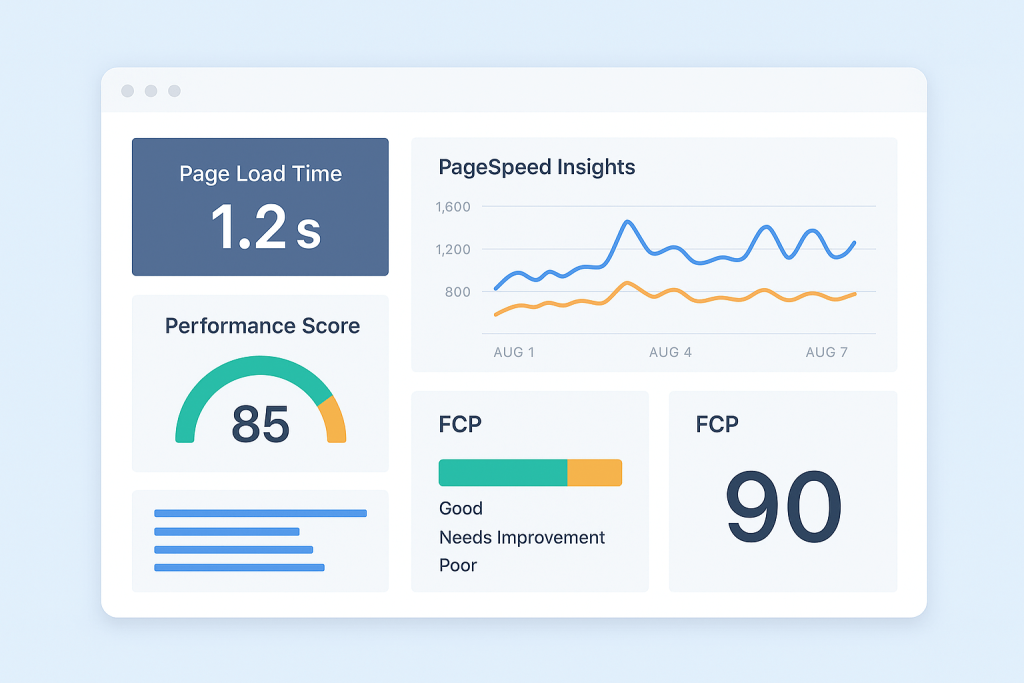
Google PageSpeed Insights
Google PageSpeed Insights is a powerful tool that combines both lab data and field data to give you a full report of website performance. Lab data from Lighthouse examines performance, accessibility, best practices and SEO. This information helps you identify areas to improve user experience.
Field data is from Chrome User Experience Report (CrUX) and shows how real visitors interact with your site by optimising for the 75th percentile benchmarks for both mobile and desktop simulations. By looking at these key metrics you can understand real user interactions and adjust accordingly.
By combining lab and field data, PageSpeed Insights gives you a full picture of your website’s overall health. The tool not only finds major issues but also suggests practical steps to speed up your site and overall user experience.
GTmetrix
GTmetrix is a powerful tool to test website performance with features to analyse page performance and customise testing parameters. What sets it apart is its ability to use CrUX data from real visitors which gives you insights into real user metrics and how they affect your site.
GTmetrix has wide coverage by allowing tests from 22 locations around the world, giving you a broad view of performance trends across different regions. It supports monitoring these trends for half a year and has simulation options for more than 40 devices – so you have many options to optimise your website’s overall functionality.
Pingdom ToolsPingdom Tools has a Website Speed Test that checks your website’s loading speed and finds performance bottlenecks. It uses more than 70 polling locations around the world to give you a full report of your site’s performance across different areas.
The service is for all levels, from beginners to pros, with color-coded response codes and detailed performance metrics to improve visitor experience. Pingdom has a free trial so you can test its monitoring features before you decide to subscribe.
DebugBear: A Tool for Advanced Lab-Based Tests
DebugBear is a powerful tool for advanced lab-based tests, it gives you a full analysis of website performance. The tool tests from 20 global test locations using both mobile and desktop devices and gives you a detailed report on various performance metrics. DebugBear’s advanced lab-based tests can find issues that may not be apparent in real-user testing, gives you a more detailed and accurate picture of your website’s performance. By using DebugBear you can get valuable insights of your site’s performance and implement effective optimisation strategies to improve user experience and overall functionality.
How to Run a Website Speed Test
Running a website speed test involves several steps, starting with choosing a speed test tool and using the speed test enter feature to input your URL for testing website performance.
Follow these steps to get accurate and actionable results.
Enter Your URL
Enter the exact URL of your website into the speed test tool you’ve chosen. This simple yet important step allows the tool to check different parts of your webpage and give you a full report of its performance.
Analyse Results
After entering your URL and running the speed test, the tool will give you a report with various metrics. The First Input Delay (FID) is an important metric that measures how fast a page responds to user inputs. This metric is key to user experience by showing how users can interact with your website once it’s loaded.
Other metrics to look into are page load time and Largest Contentful Paint (LCP). These benchmarks help you find which requests block rendering or contribute to LCP images.
Tools like NoScript. Test gives you insight on how webpages perform with JavaScript enabled and disabled, and where performance can be improved.
Find BottlenecksYou need to find the bottlenecks in your website. Often these bottlenecks are big files like HTML, CSS and images which slow down performance mainly because of large images and fonts in a site.
To fix this you can use modern image formats like WebP and AVIF which reduce image file size without compromising quality. Merge and minify CSS and JavaScript files. This will reduce load times by reducing the number of HTTP requests for a website.
Optimising Your Website
After finding the bottlenecks you need to implement optimisation techniques. This includes compressing images, reducing resource size through minification and using browser caching. The goal is to make your site load fast and work smooth.
Image Optimisation
Website performance and user experience depends on the loading of webpages and image optimisation plays a big role. Using lazy loading allows images not to load immediately and only load when needed, thus speeding up initial page loads and saving bandwidth.
Combining lazy loading with image compression can greatly improve both the speed of your website and overall performance. By finding images to optimise and managing resource requests strategically you ensure your webpage runs at peak performance.
Minifying Resources
By minifying CSS, HTML and JavaScript files the file size shrinks which results to faster download times and faster loading. Automation tools like UglifyJS for JavaScript and CSSNano for CSS can streamline this process by removing unnecessary characters including whitespace and comments from the code to optimise performance.
Browser Caching
Enabling browser caching can improve user experience by saving a version of your website that returning visitors can quickly retrieve. This shortens the load times for frequently visited resources and boosts your website’s performance.
By setting proper cache expiration headers you manage the duration that resources are cached. This ensures users get faster page loads on follow-up visits. Efficient browser caching contributes to faster loading and overall better experience for visitors revisiting your site.
Monitor and Maintain Website PerformanceYou need to continuously monitor your website to make sure it runs at optimal speed and delivers smooth user experience. Using tools like Pingdom can monitor uptime and overall website performance and send notifications when there are significant changes in site metrics so you can optimise in time.
Real-User Monitoring
Monitoring real user experiences through tools like DebugBear which focuses on real-user monitoring gives you valuable data about how real users interact with your site. By looking at changes in website performance metrics over time you can pinpoint areas to improve and verify site functionality across different devices and network environments.
Evaluating how your website performs under different network scenarios is key to finding performance issues that will affect users with less robust connections. This thorough test gives you a deeper insight into user engagement with your website so you can make more effective optimisation strategies.
Scheduled Performance Tests
You need to set up performance testing routines to monitor trends and proactively make changes to ensure highest website performance. By automating these tests you can identify long term patterns that will help in preemptive optimisation and detect potential problems before they affect users.
Alerts and Notifications
Setting up alerts and notifications triggered by performance metrics ensures quick reaction to potential problems. With real-user monitoring webmasters get immediate notifications when performance drops so they can fix issues before they affect user experience.
Advanced Performance Testing
Using advanced performance testing methods can give you a better understanding of website efficiency so you can pinpoint and fix complex issues. These include comparing mobile vs desktop website performance, emulating different network environments and setting up benchmarks for website speed and resources.
Mobile vs Desktop Testing
You need to recognize that performance metrics can be very different between mobile and desktop devices due to the differences in hardware and network conditions. To ensure consistent user experience across all platforms you need to test in both mobile and desktop environments. There are tools that allow you to select either mobile or desktop version for testing before inputting the website URL.
Understanding these differences is key to speeding up your website and improving overall user satisfaction.
Simulating Different Network ConditionsYou need to test a website on mobile by testing across different network environments since mobile connection quality varies greatly. This will show you how the site behaves with different latencies and bandwidths and gives you a deeper insight into the user experience it delivers.
Performance Budgets
Setting a performance budget sets boundaries for your site’s speed. By doing this you can make sure your website meets specified load times and is fast and quick and preserves peak performance and user experience.
Case Studies: Website Optimisation
Reading case studies of website optimisation is a treasure trove of knowledge and inspiration.
We will review examples from e-commerce and blog websites that have made significant improvements to their performance.
E-commerce Site Optimisation
By optimising their e-commerce website a business saw a big improvement. A 54% increase in purchase rate was achieved by showing free shipping promotions at the early stage of checkout. A small but significant change that led to higher completion rates among customers for their purchases. Shows that even small changes can lead to big improvements in conversion rates.
Using methods like image optimisation and browser caching were key in reducing page load times. Focusing on these areas gave big benefits to the e-commerce site. It was clear that fine tuning site performance is directly connected to user engagement and conversion metrics.
Blog Performance Optimisation
Optimising blogs can yield big rewards. By streamlining scripts and using a more efficient theme one well known blog was able to cut down page load time from 8 seconds to 2 seconds. This speed improvement resulted to lower bounce rates which in turn increased user engagement and conversion rates overall.
Showing top selling content on the home page led to higher user involvement and more product exploration from the blog. These changes showed how important it is to refine both page speed and content organisation to boost website performance and user satisfaction.
Conclusion
Optimising your website performance is not just about faster page load times—it’s about creating a smooth and enjoyable user experience that keeps visitors engaged and coming back for more. By understanding the importance of speed, tracking key metrics, using the right tools and implementing effective optimisation strategies you can greatly improve your site’s performance. Remember continuous monitoring and proactive adjustments are key to optimal performance. Start optimising today and watch your website thrive!
FAQs – Why is website speed important for SEO?
Website speed is super important for SEO since Google favours fast loading sites and you rank better in search results.
So, speed it up!
What are Core Web Vitals?
Core Web Vitals are key metrics like LCP, FID and CLS that measure how well your site loads, responds and feels to users.
Keep an eye on these to improve user experience and site performance!
How do I test my website’s speed?
You can test your website’s speed using tools like Google PageSpeed Insights, GTmetrix or Pingdom Tools.
Just enter your URL and you’ll get a performance report to help you improve!
What is real-user monitoring?
Real-user monitoring is about keeping an eye on how real users interact with your site in real-time and gives you valuable insights into their experience.
This helps you spot issues and improve performance where it matters.
How do I optimise images for better performance?
To improve performance try lazy loading images, compressing them and using modern formats like WebP or AVIF.
These will reduce file sizes and speed up load times!


